TL;DR
CSR reporting failures are rarely communication failures. They are data and process failures that surface at publication. With the EU Green Claims Directive taking effect in 2026 and CSRD already live, organisations running on narrative-led reporting are accumulating compliance risk by the quarter. This guide maps the ten most damaging pitfalls into three failure modes: integrity, architecture, and strategy, and shows what a credible, audit-grade alternative looks like for each.
Key Statistics at a Glance
Why CSR Reports Are Losing Credibility
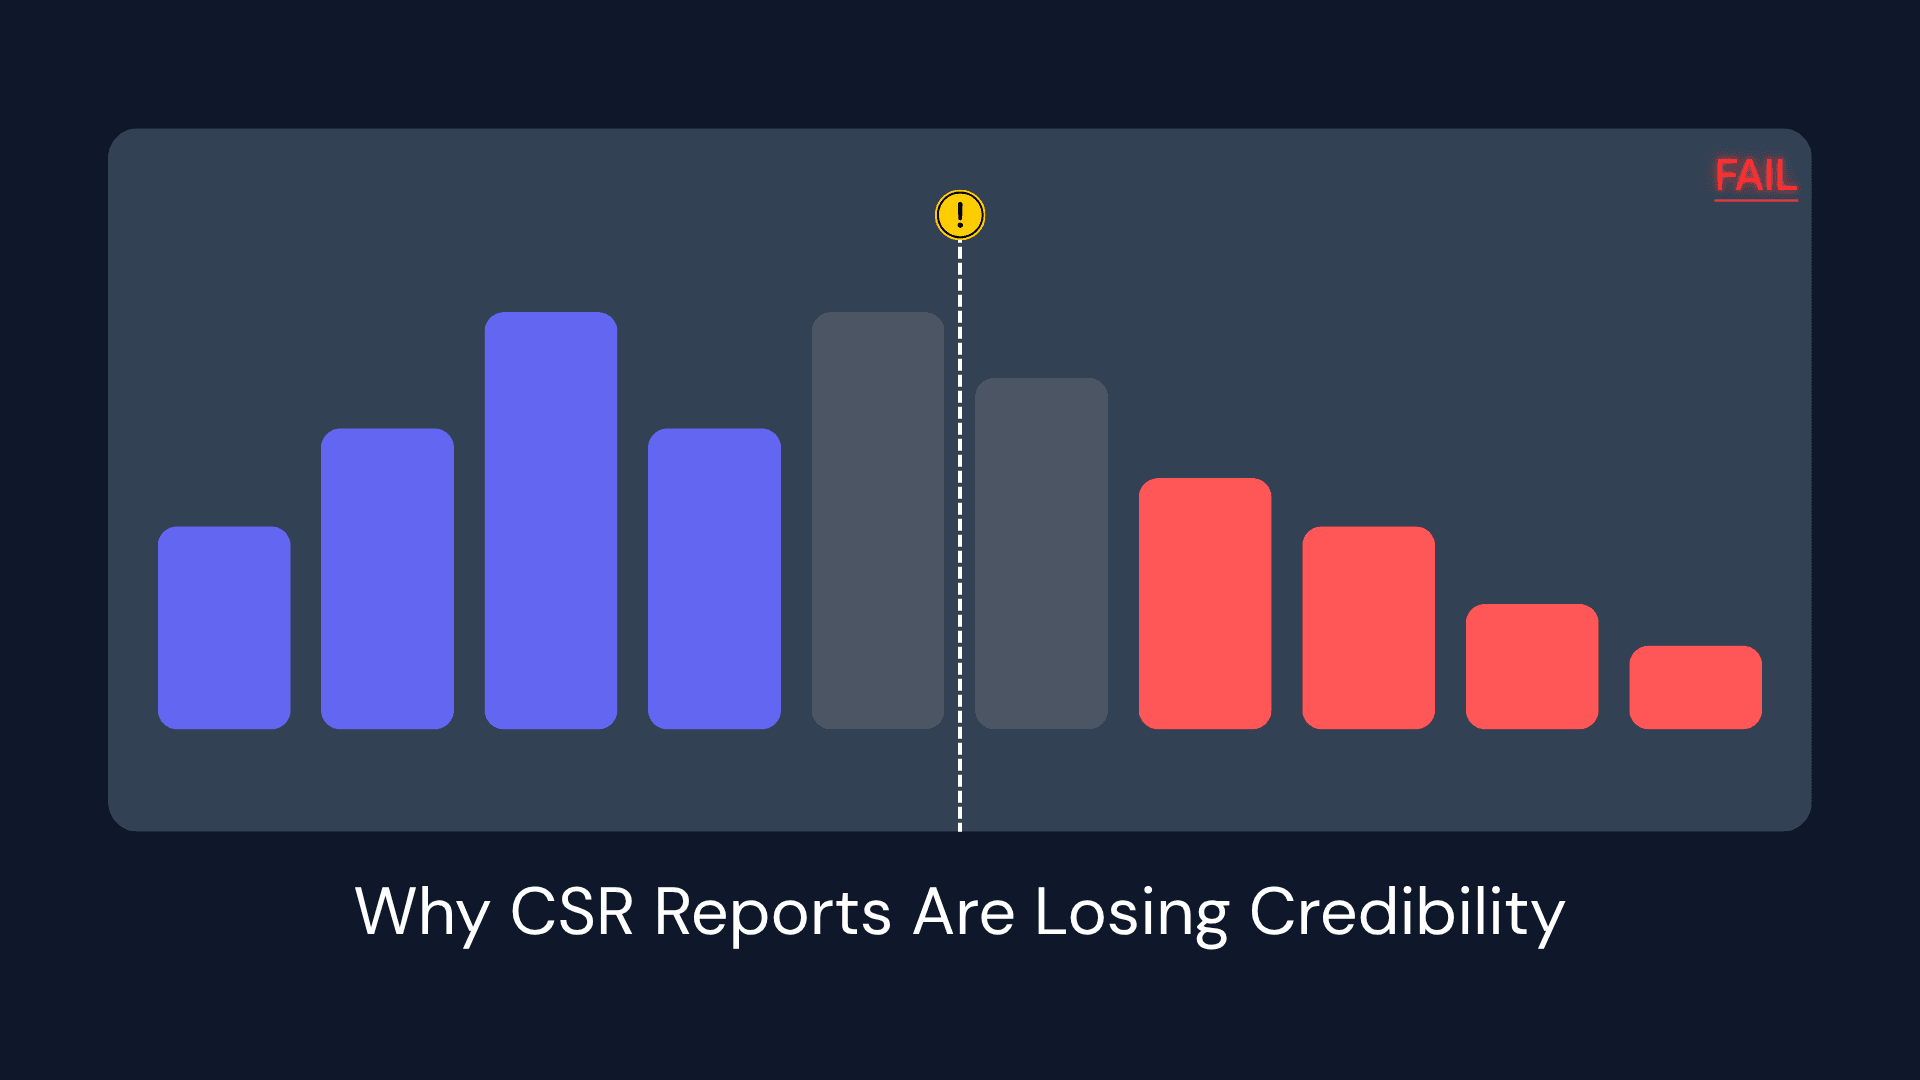
Over the past decade, Corporate Social Responsibility (CSR) reporting has scaled exponentially. Budgets have grown, teams have expanded, and disclosure platforms have multiplied. Yet a paradox has emerged: as the volume of reports increases, stakeholder trust has flatlined.
The issue is not a lack of willingness to report. It is a structural gap in scrutiny. When the European Commission found that 53% of green claims were vague or unfounded, it marked the end of the narrative-first era. With the EU Green Claims Directive, CSRD, and ISSB rules now either live or imminent, a report is only as credible as the data infrastructure behind it.
The Relific position: The majority of CSR reporting failures are not communication failures. They are data and process failures that surface at publication. The organisations producing the most credible, investor-grade, regulator-proof reports did not start with better writers. They started with better infrastructure.
Research from the University of New South Wales Centre for Social Impact crystallises the diagnosis: organisations default to metrics that are easy to collect, workplace safety incidents, training hours, headline diversity ratios, while systematically avoiding metrics that are harder to instrument but materially more important: Scope 3 emissions, supply-chain labour conditions, community-level outcomes, living-wage compliance across the value chain.
This is not a disclosure philosophy problem. It looks like a disclosure choice, but it is a data availability problem. You can only report what you can see. Most organisations have engineered their measurement systems around convenience, not materiality.
The Three Failure Modes of CSR Reporting
| Category | Pitfalls | Root Cause | Where It's Detected | Who Fixes It |
|---|---|---|---|---|
| Integrity Failures | 1–3 | Data | At publication | Policy & governance |
| Architecture Failures | 4–7 | Process | At publication | Systems & data owners |
| Strategy Failures | 8–10 | Leadership alignment | Late (after the cycle) | Executive team |
Each category requires a different intervention. Integrity failures need policy and governance changes. Architecture failures need systems investment. Strategy failures need executive alignment and organisational redesign. Diagnosing the category tells you who needs to fix it; that is the point of the framework.
CSR Reporting Frameworks at a Glance
| Framework | Primary Focus | Materiality Type | Geographic Scope | Status in 2026 |
|---|---|---|---|---|
| GRI | Impact on society and environment | Impact materiality | Global | Voluntary (most widely used) |
| SASB / ISSB | Financial performance impact | Financial materiality | Global | Becoming mandatory across jurisdictions |
| ESRS (under CSRD) | Both impact and financial | Double materiality | EU-scope entities | Mandatory from FY2024 |
| TCFD | Climate-related financial risk | Financial materiality | Global | Absorbed into ISSB |
| UN SDGs | Global development goals | Goal alignment | Global | Voluntary |
| ISO 26000 | Social responsibility principles | Principles-based | Global | Voluntary guidance |
These are not optional best practices. CSRD already mandates ESRS-aligned reporting for EU-scope entities. ISSB standards are in the adoption pipeline across jurisdictions representing more than half of global GDP. Organisations treating these as "nice to have" are accumulating both regulatory and reputational risk.
Part I · Integrity Failures What's in the Report
These are problems with the accuracy, completeness, and honesty of the underlying content. The report may be polished, but it will not survive scrutiny.
Pitfall 1: Narrative Over Verifiable ESG Metrics
Narrative-led CSR reporting is the practice of filling the report with unverifiable language, "meaningful progress," "committed to positive change", in place of sourced, methodology-backed data. It is the most visible form of greenwashing and the first thing regulators, investors, and AI-driven ESG analytics platforms flag.
The Problem
- Unverifiable language ("making meaningful progress," "committed to positive change") fills the space where metrics should be
- Positive stories are amplified; missed targets and controversies are omitted, not through conspiracy, but because the data to contextualise them does not exist
- Achievements are framed without disclosed baselines, methodology, or measurement scope, making them impossible to verify or replicate
- Peripheral initiatives (volunteer days, one-off donations) receive disproportionate coverage while core operational impacts go unreported
Regulatory Context
The EU Green Claims Directive (enforcement: 2026) makes unsubstantiated environmental claims a legal liability, not just a reputational risk: requiring independent verification before claims are made public. The SEC climate disclosure rules set a parallel precedent that narrative-only reporting is insufficient for any material ESG claim. Critically, detection capability has transformed: ESG data aggregators like MSCI, Sustainalytics, CDP, and S&P Global now cross-reference reported claims against operational data, satellite imagery, and supply-chain databases. The gap between what is claimed and what is observable is shrinking fast.
What Good Looks Like
- Every claim is anchored to a specific figure, cited source, and disclosed methodology; if it cannot be sourced, it does not go in the report
- Equal rigour applied to progress reporting and shortfall reporting; the shortfalls section should be as well-documented as the wins
- Third-party assurance on key metrics is treated as a structural discipline, not a credibility badge
The Relific Position
Fix the system, not the sentence. Greenwashing is rarely a deliberate strategy; it is what happens when teams are forced to fill a report with narrative because they do not have the data to fill it with evidence.
Pitfall 2: The Broken ESG Data Pipeline
A broken ESG data pipeline is a reporting infrastructure where sustainability data is collected manually, across disconnected spreadsheets, with no standardised definitions or version control. It is the single most damaging CSR reporting failure because it corrupts every downstream claim in the final report.
The Problem
- Manual, spreadsheet-based collection across departments introduces inconsistency, human error, version-control failures, and undocumented estimation
- No standardised definitions or units, HR measures "employee engagement" differently from Operations measuring "workforce satisfaction"; finance tracks carbon costs on a different scope boundary than sustainability
- Scope 3 emissions and supply-chain data are systematically excluded, despite typically representing the majority of actual environmental and social impact
- Data is collected reactively during the annual sprint, meaning the numbers reflect what was recoverable under deadline pressure, not what actually happened
Regulatory Context
CSRD and ESRS are raising the auditability bar to match financial reporting standards. Sustainability data will need the same traceability, version control, and sign-off rigour as a set of accounts. Investors now stress-test data across report sections and across years; inconsistencies between a company's carbon figure in the environmental section and the same number used in the risk section are immediately flagged. Organisations that discover data errors post-publication face a restatement problem with no good options.
What Good Looks Like
- Centralised data infrastructure with standardised definitions, agreed collection cadences, and automated validation workflows
- Designated, accountable data owners within each business unit, with clear escalation paths when data quality falls below the threshold
- Continuous collection with formal quarterly review checkpoints, not an annual sprint before publication
- Full documentation of sources, methodologies, estimation approaches, and known limitations; the audit trail matters as much as the final number
The Relific Position
This is the most structurally damaging pitfall on this list because it corrupts everything downstream. A polished report built on unreliable data doesn't just mislead stakeholders, it misinforms the organisation itself. Procurement decisions, capital allocation, and risk modelling are all built on numbers that don't reflect reality. The report is the visible symptom. The broken data pipeline is the disease.
Pitfall 3: Unmeasurable Targets and Aspirational Drift
Unmeasurable CSR targets are sustainability commitments set without disclosed baselines, methodology, or interim milestones: "net zero by 2040," "30% reduction," "aiming to lead." Without a measurement architecture, they are statements of intent, not commitments.
The Problem
- Undefined baselines: Setting a "30% reduction" goal without disclosing the starting year, measurement scope, or specific methodology
- Aspirational drift: Using intent-based language, "aiming to lead," "striving for change" that provides no numeric threshold for success or failure
- Calibration for PR: Goals designed to capture headlines at announcement rather than drive operational change through intermediate milestones
Regulatory Context
Science-Based Targets initiative (SBTi) validation is increasingly a prerequisite for credibility with institutional investors, and SBTi requires specific methodological rigour that vague targets cannot satisfy. Coalitions like Climate Action 100+ now track target delivery, not target announcement, and the gap between the two is where reputational damage happens. Without linkage to business strategy and executive compensation, sustainability goals rarely attract the resources or urgency required to achieve them.
What Good Looks Like
- SMART targets with stated baselines, defined methodology, intermediate milestones, and long-term horizons
- Explicit linkage to material issues, business strategy, and executive accountability, including disclosure of how sustainability performance factors into compensation decisions
- Honest reporting against targets every cycle, including when targets are missed, why, and what the remediation plan is the willingness to report failure credibly is itself a credibility signal
The Relific Position
A target without a measurement architecture is just a statement of intent. Credible organisations treat target-setting as a data commitment: what is the number, who owns it, and what is the remediation plan if it is missed?
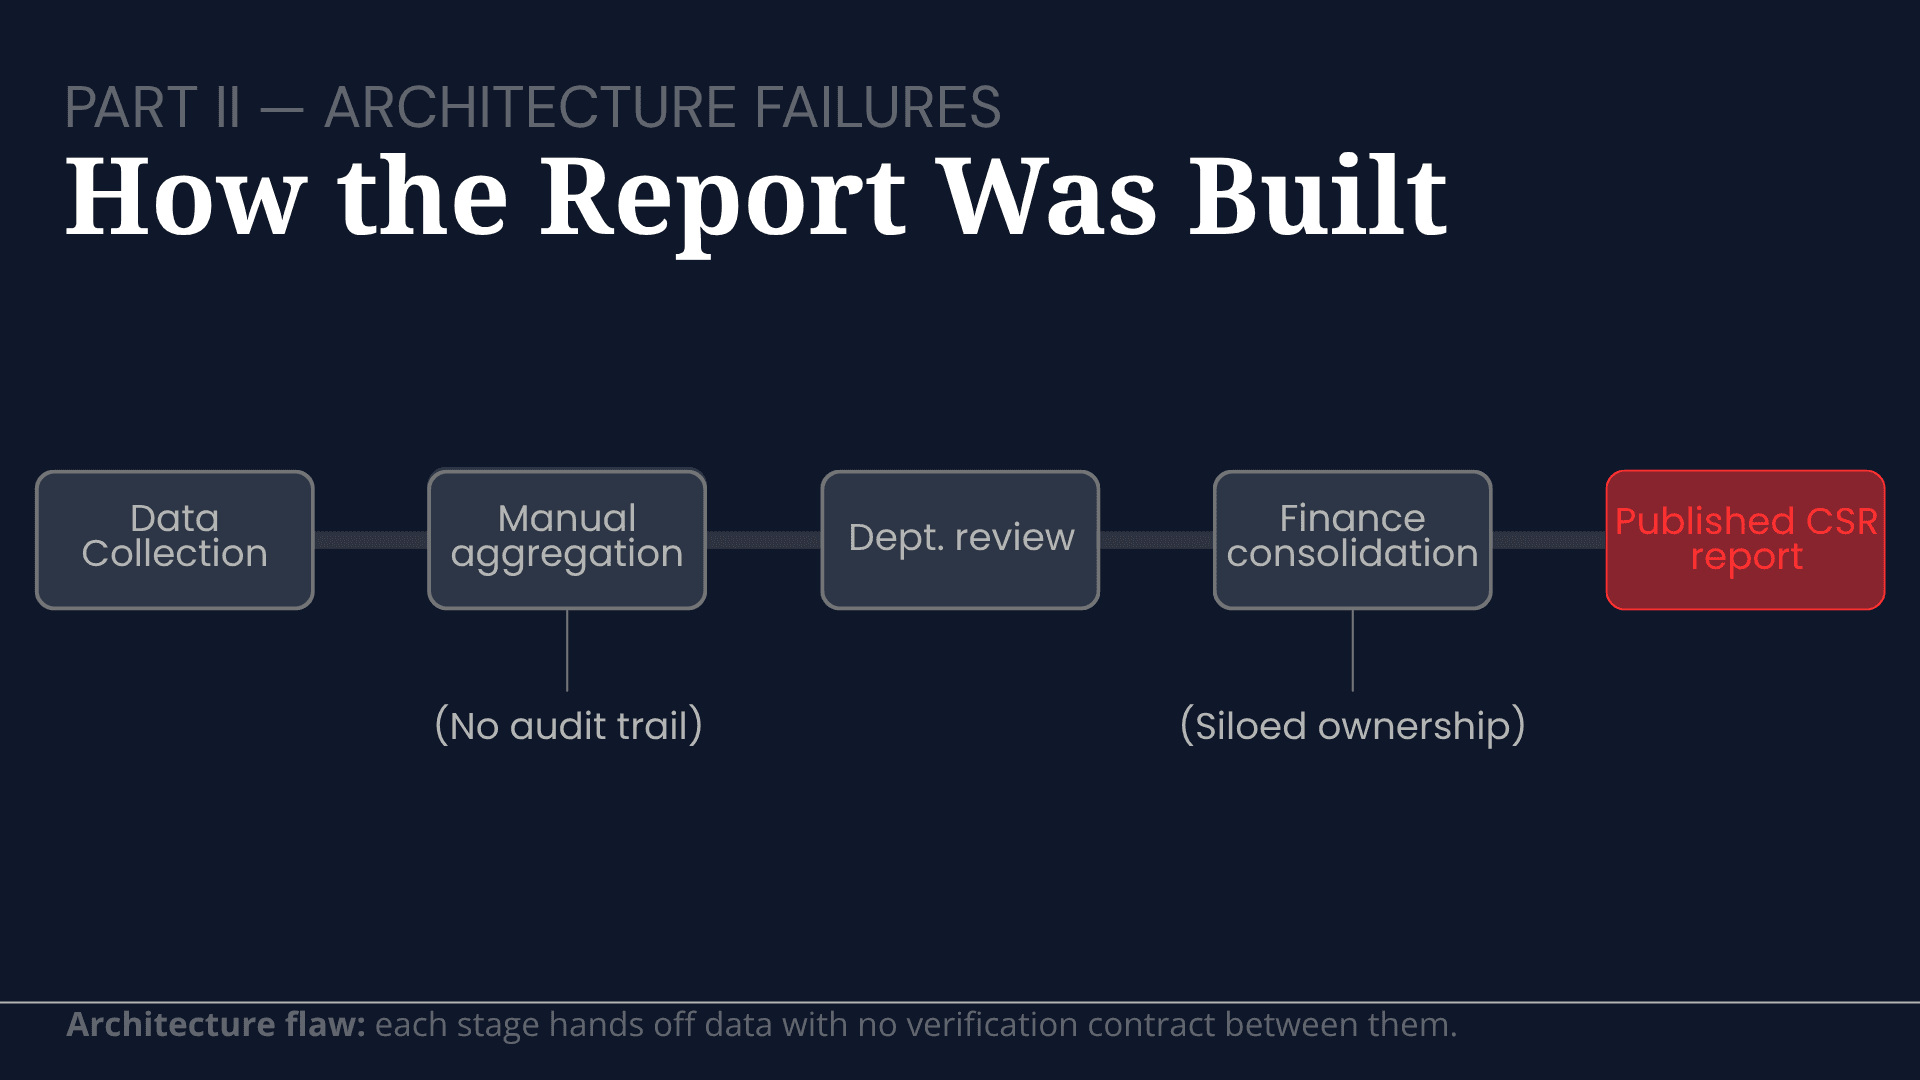
Part II Architecture Failures: How the Report Was Built
These are problems with the data systems, governance processes, and assurance mechanisms that produce or fail to produce credible output. The inputs are flawed before the writing begins.
Pitfall 4: Failing Double Materiality Under CSRD
Double materiality is the CSRD/ESRS requirement that organisations report both how sustainability issues affect the business (financial materiality) and how the business affects society and the environment (impact materiality). Failing it means producing a materiality matrix built on internal assumptions dressed as evidence.
The Problem
- Functional isolation: Reports produced by sustainability teams writing about issues that the rest of the organisation and its stakeholders have not been genuinely consulted on - Misaligned prioritisation: Material issues ranked by internal comfort and data availability, not by stakeholder materiality, creating a disconnect between what is disclosed and what is relevant - Late engagement: Stakeholder feedback solicited too late to meaningfully influence content, scope, or framing, turning engagement into a retrospective validation exercise - No reciprocity: No formal mechanism for stakeholder response after publication of the report lands as a monologue, not the start of a dialogue
Regulatory Context
Under CSRD and ESRS, demonstrating both financial and impact materiality is required, and impact materiality is impossible to defend without genuine external input. ESG-focused investors and rating agencies (MSCI, Sustainalytics, ISS ESG) specifically evaluate the quality and documentation of engagement. It is a rated dimension, not a soft one. Limited engagement leads organisations to headline metrics that communities, employees, and supply-chain workers find irrelevant or tone-deaf.
What Good Looks Like
- Documented stakeholder engagement conducted at least annually, with findings published, not merely summarised
- Diverse methodology: surveys for breadth, interviews and focus groups for depth, advisory panels for continuity
- A materiality matrix is reviewed and updated each reporting cycle based on fresh input, not recycled from the prior year
- A published process for post-report engagement, on how readers can respond, and what happens with that input
The Relific Position
Stakeholder engagement is typically classified as a relationship-management activity. In practice, it is a data-gathering discipline. The materiality matrix, which determines the entire scope and emphasis of the report, is only as credible as the process that produced it. A process that skips systematic stakeholder input is producing assumptions dressed as evidence.
Pitfall 5: Benchmarking Against Yourself Instead of the Sector
Internal benchmarking is the practice of measuring CSR performance only against the organisation's own prior years, rather than against named sector peers. It tells you whether you are improving, not whether you are good.
The Problem
- Internal vacuum: Year-on-year internal benchmarking only ("we improved 12% vs. last year") with no reference to whether that improvement is sector-leading, average, or below par - Selective data: Favourable comparison points selected without disclosing selection criteria, cherry-picked peers, convenient baselines, flattering scope boundaries - Methodological avoidance: Differences across the sector are used as an excuse to avoid comparison, rather than as an argument for adopting shared standards
Regulatory Context
Rating agencies like MSCI, Sustainalytics, and S&P Global benchmark companies against sector peers as a matter of course; a report that makes this impossible is automatically less useful. The inability to be benchmarked is increasingly read as a signal: if the comparison would be favourable, why avoid it? SASB standards are sector-specific by design, built precisely to enable cross-company comparison.
What Good Looks Like
- Alignment with sector-specific SASB metrics, enabling direct peer comparison
- Explicit acknowledgement of where the company leads, where it lags, and the plan to close those gaps
- Disclosures sufficient for external analysts to make valid, apples-to-apples comparisons
The Relific Position
Internal benchmarking tells you whether you are improving. It does not tell you whether you are good. These are different questions, and the stakeholders who allocate capital, make procurement decisions, and choose employers are asking the second one. A report that makes external comparison impossible is not being cautious; it is being strategically opaque.
Pitfall 6: The Annual Obligation Trap
The annual obligation trap is treating CSR reporting as a compliance deliverable to discharge once a year, rather than as a strategic management system that informs decisions throughout the reporting cycle.
The Problem
Compliance mindset: The report is treated as a document to produce, not a tool to deploy Low utility: Content is driven by regulatory minimums, dense, technical, jargon-heavy, and read by almost no one outside the sustainability team Siloed data: Sustainability data never connects to procurement decisions, product design, risk modelling, or capital allocation No cross-functional ownership: Finance, HR, procurement, and operations are consulted for data extraction, not engaged as co-owners
The Diagnostic Test
Does anyone outside the sustainability team use this report to decide during the year? If the answer is no, it is a compliance artefact, not a strategic tool.
Regulatory Context
CSRD, ESRS, and ISSB frameworks are explicitly designed to integrate sustainability into mainstream corporate governance. Compliance-only approaches fall short of both the letter and the spirit of these regulations. The organisations attracting the most favourable ESG ratings from MSCI, Sustainalytics, and S&P Global are those where the sustainability report is visibly connected to the strategic narrative in the annual report and investor presentations.
What Good Looks Like
Executive-level ownership of the reporting process, not delegation to a mid-level sustainability manager Content explicitly linked to business goals, financial KPIs, and strategic priorities Teams from finance, operations, and HR are contributing to data collection, review, and interpretation The report was used as a live management reference throughout the year, cited in board papers, supplier negotiations, and investor calls
The Relific Position
When reporting is built around compliance, the output is a document. When it is built around a strategy, the output is a management system. The first produces a PDF nobody reads. The second produces decisions that change how the business operates.
The test is simple: Does anyone outside the sustainability team use this report to decide during the year? If the answer is no, it's a compliance artefact, not a strategic tool.
Pitfall 7: Avoiding Recognised Frameworks Like GRI, ESRS, and SASB
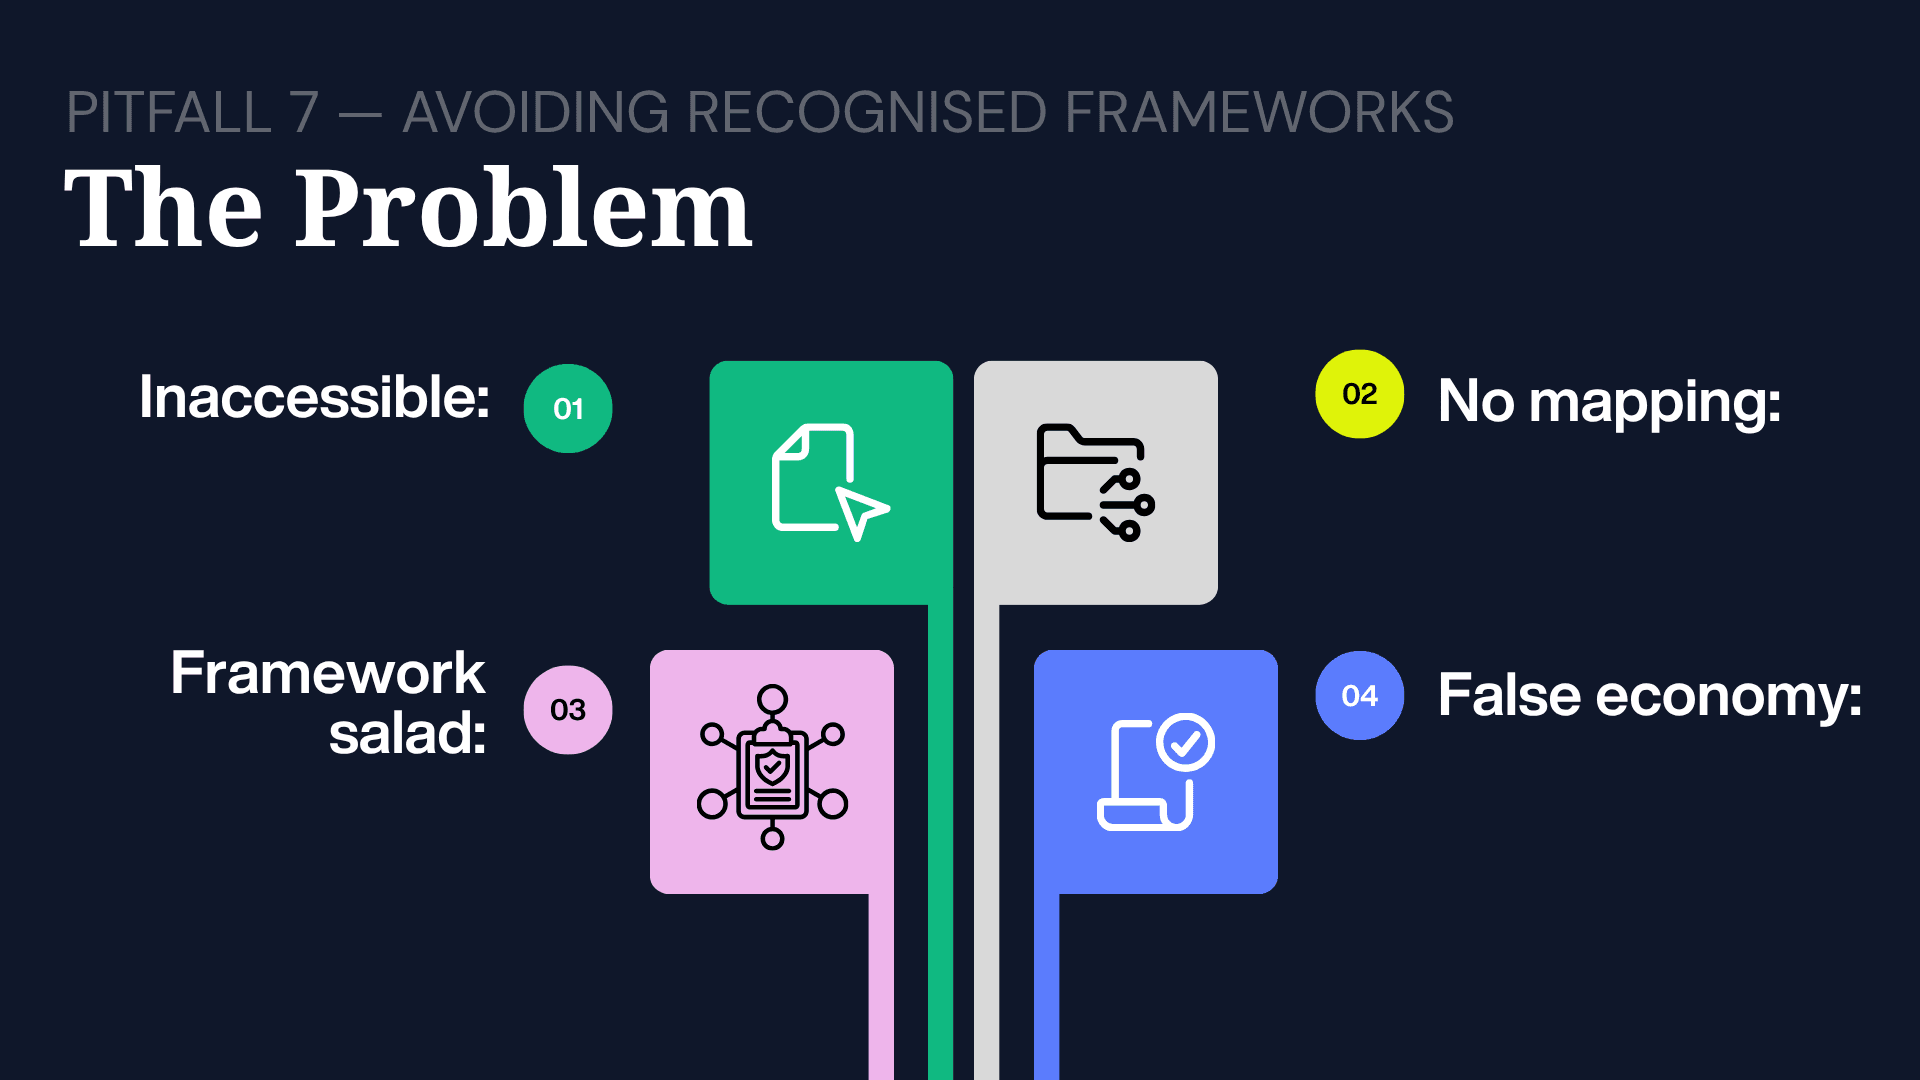
Avoiding recognised ESG frameworks means publishing CSR reports with proprietary structures and bespoke metrics instead of aligning to GRI, ESRS, SASB/ISSB, or TCFD. The result: content that cannot be independently verified, benchmarked, or audited.
The Problem
Inaccessibility: Proprietary structures and bespoke metrics make independent assessment, comparison, or audit impossible Missing maps: No GRI content index, SASB mapping, or SDG alignment table, nothing that allows a reader to verify completeness against an external standard "Framework salad": Selective, superficial referencing of multiple frameworks creates the appearance of rigour without the structural commitment False economy: Framework adoption avoided due to perceived cost, without recognising that alignment reduces future retrofitting costs and improves credibility
Regulatory Context
CSRD mandates ESRS alignment; ISSB-aligned rules are rolling out globally. The window for voluntary, bespoke reporting is closing. Without alignment, reports cannot be meaningfully benchmarked or audited. GRI, SASB, TCFD, and ESRS exist to create consistency; opting out removes the organisation from the global system of trust.
What Good Looks Like
- A primary framework selected based on sector, geography, and regulatory exposure, with a clear published rationale
- A standards index that maps report content to specific framework disclosures, making verification straightforward
- Reporting processes designed to meet framework requirements from the outset are built in, not bolted on
The Relific Position
Framework alignment is often viewed as an additional layer of bureaucracy. In practice, it’s the opposite: it’s the specification that tells you what to collect, how to collect it, and how to present it. Organisations that build data processes around a framework from the start spend less time and money on reporting; not more.
Part III Strategy Failures: How Reporting Fits the Organisation
These are problems with whether reporting drives decision-making or merely documents activity for external consumption. These failures persist because they are invisible until the organisation's trajectory diverges from its stated commitments
Pitfall 8: The Once-a-Year Broadcas
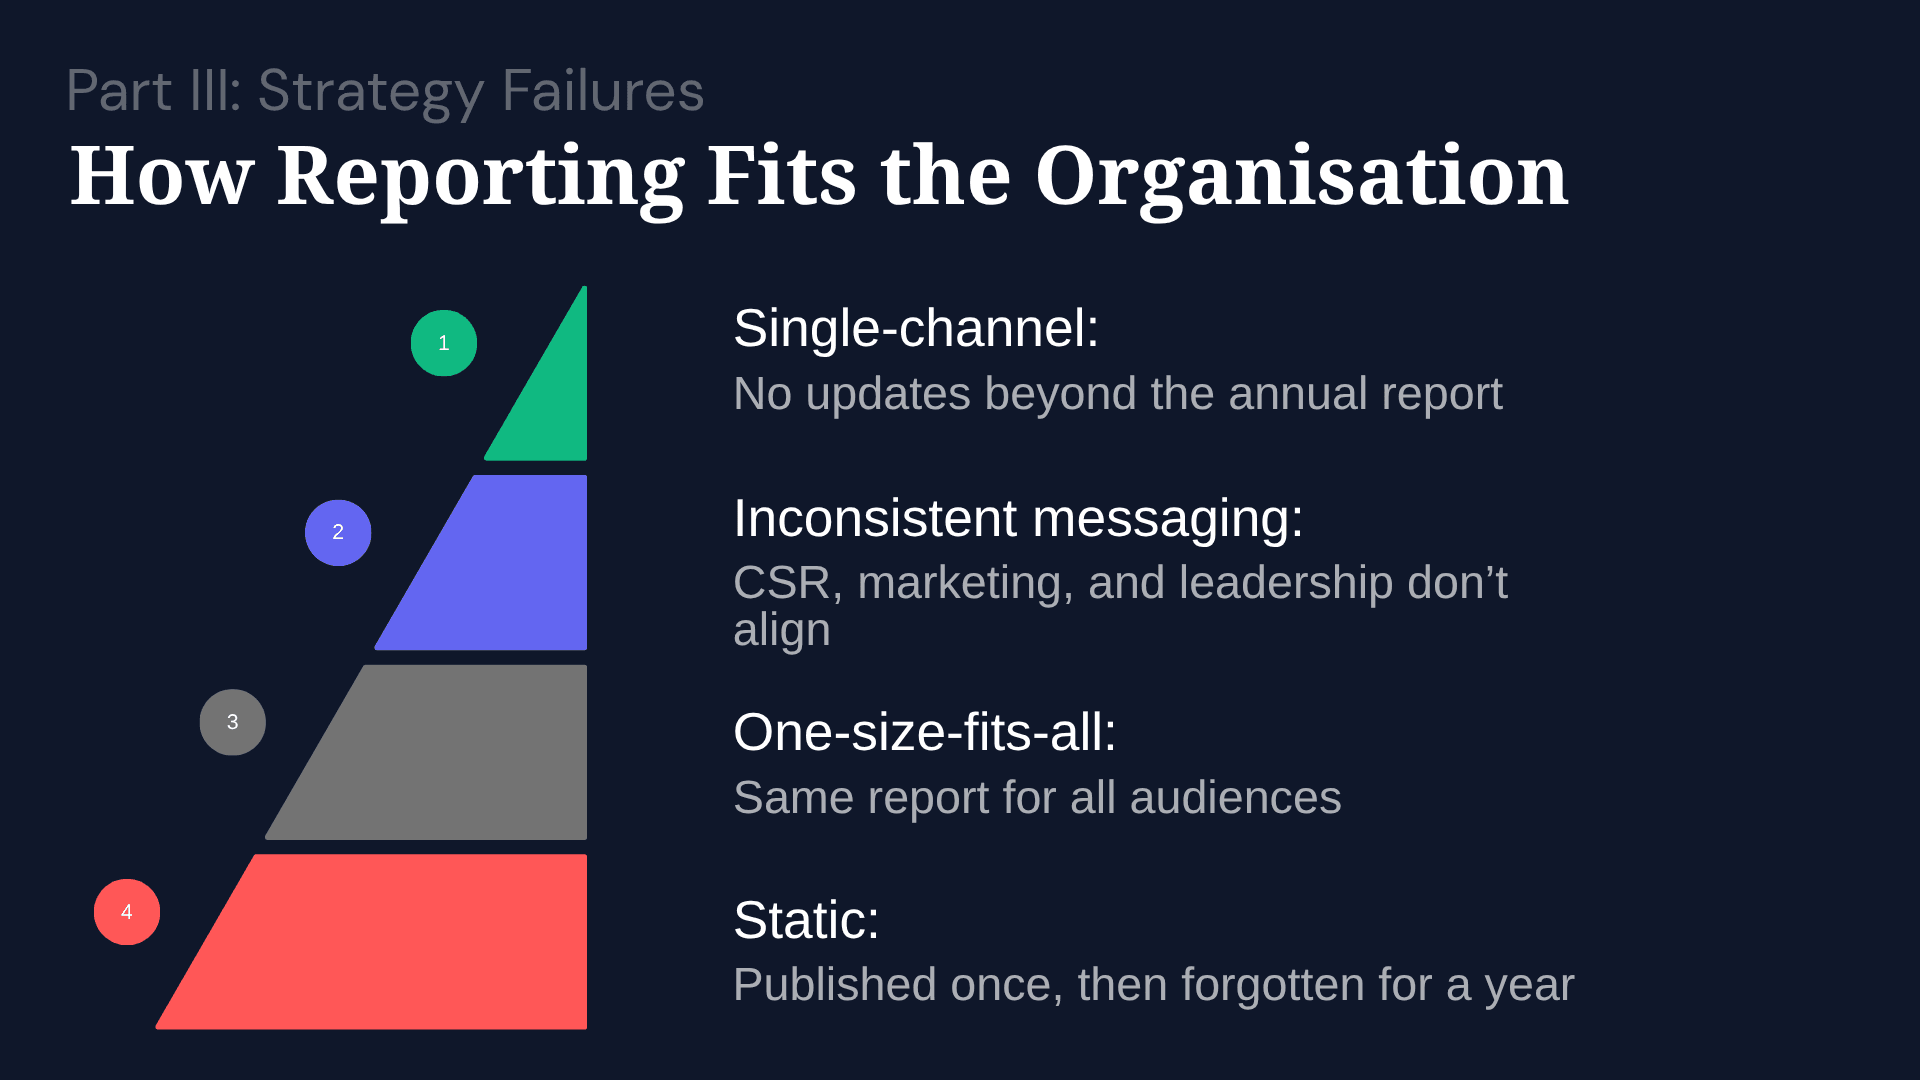
The once-a-year broadcast is the pattern of using the annual CSR report as the sole sustainability communication channel with no interim updates, dashboards, or stakeholder-specific briefings. It concentrates trust-building into a single event rather than compounding it continuously.
The Problem
Single-channel reliance: No interim updates, employee communications, investor briefings, or customer summaries Inconsistent messaging: The CSR report, marketing materials, and the CEO's keynote give conflicting messages on material issues Monolithic delivery: One document sent to all audiences, investors, employees, customers, regulators, despite vastly different information needs and literacy levels
Static lifespan: Published once, announced once, then effectively archived until the following year What Good Looks Like
A communications calendar with quarterly touchpoints across owned, earned, and stakeholder-specific channels Tailored outputs: investor briefs (data-dense), employee summaries (action-oriented), community updates (impact-focused) Mid-year dashboards are published on the website to create accountability and demonstrate confidence Report content embedded in investor presentations, procurement decisions, and HR processes throughout the year
The Relific Position
Annual reporting was designed for an era when data was hard to collect and expensive to publish. Neither constraint exists anymore. Organisations limiting communication to a single annual document are leaving a significant trust asset on the table. The strongest reputations are built through continuous communication: quarterly dashboards, mid-year updates, and issue-specific briefings. The annual report should be the capstone, not the whole building.
Pitfall 9 The Brochure Problem: Narrative Without Quantitative Data
The brochure problem is the pattern of producing visually polished CSR reports dominated by case studies and photography, but light on hard metrics, baselines, and trend data. Glossier reports attract more scepticism, not less.
The Problem
Substance gap: Heavy on case studies and photography, light on metrics, baselines, and trend data **Unanchored claims: **Qualitative claims like "significant positive impact" without specifying reach, outcomes, methodology, or cost Snapshot reporting: Single-year data snapshots with no historical context, making the trajectory impossible to assess Aesthetic compensation: High-end visual design used to compensate for substantive thinness
Regulatory Context
ESRS requires specific quantitative disclosures. Organisations without a data infrastructure will face compliance gaps that they cannot navigate their way out of. ESG analysts at MSCI, Sustainalytics, and CDP distinguish between visual substance and factual substance. Without multi-year trend data, the default assumption is usually the least favourable one.
What Good Looks Like
- Every qualitative claim is paired with a quantitative measurement or outcome indicator
- Multi-year trend data (3–5 years) for all key metrics, with explanations for significant changes
- Third-party assurance on material quantitative disclosures, clearly distinguished from unassured figures
The Relific Position
Narrative without data is marketing; data without narrative is a spreadsheet. Credibility requires both. In practice, the gap is almost always on the quantitative side. Organisations rarely lack stories, but they frequently lack the numbers that make those stories credible. Invest in the numbers; the stories will find themselves.
Pitfall 10: Short-Termism in Sustainability Strategy
Short-termism in sustainability strategy is the systematic deprioritisation of long-payback ESG initiatives in favour of current-quarter financial metrics. The deferred costs, reputational damage, regulatory penalties, and supply-chain disruption are consistently higher than the costs avoided.
The Problem
Deprioritisation: Sustainability initiatives with long payback periods are systematically cut in favour of current-quarter financial metrics** Zero-sum logic:** The Triple Bottom Line is treated as a trade-off where profit consistently wins resource allocation Horizon mismatch: 1–2 year goals set for issues (like climate transition) that operate on 5–20 year timescales Conditional commitment: Sustainability budgets are the first to be cut during downturns, signalling that the commitment was never structural
Regulatory Context
Long-duration investors, pension funds, sovereign wealth funds, and major asset managers explicitly penalise short-term CSR strategies. The cost of sustainability inaction compounds over time: regulatory penalties and transition costs escalate the longer they are postponed.
What Good Looks Like
- Strategy tied to a 10+ year horizon with clear interim milestones and progress tracking
- Sustainability is viewed as a component of business resilience and long-term value, not a discretionary expense
- Capital frameworks that model long-term sustainability returns alongside short-term financial metrics
- Performance framed within a long-term trajectory showing where the organisation is heading, not just where it stands today
The Relific Position
NShort-termism in CSR is not a values failure. It is an accounting error. The costs it defers, reputational damage, regulatory penalties, talent attrition, and supply-chain disruption, are consistently larger than the costs it avoids. Harvard Business School and McKinsey have both done the work. The numbers are not ambiguous. Treating CSR as an obligation to minimise is not pragmatism. It is mispricing risk. The bill arrives later, larger, and less negotiable.
CSR Reporting Checklist: Score Your Current Practice
Check each statement that currently describes your organisation. Be honest, this tool is only useful if you are.
Integrity: What's in your report
Data-backed claims. Every material claim has a source, figure, and methodology. We do not use language like "meaningful progress" without a number behind it. Scope 3 transparency. We report Scope 3 emissions with documented methodology, not deferred as "work in progress" for the third consecutive year. Balanced disclosure. Our report includes material performance declines, not just wins. Shortfalls are documented with the same rigour as achievements. Target accountability. All sustainability targets have stated baselines and measurement methodology. We disclose when targets are missed and what the remediation plan is.
Architecture: How your report was built
Authentic materiality. Our materiality matrix was informed by genuine stakeholder input this cycle, not recycled from the prior year. Competitive benchmarking. We benchmark performance against named sector peers with disclosed methodology, not just year-on-year internal improvement. Continuous collection. ESG data collection is continuous, not an annual sprint. We have designated data owners and a version-controlled system of record. Framework rigour. We are aligned to at least one primary framework (GRI, ESRS, ISSB, SASB) with a published content index genuinely compliant, not superficially referenced.
Strategy: How reporting fits your organisation
Operational integration. Executives outside the sustainability team cite the CSR report in decisions it informs procurement, product design, risk management, or capital allocation. Continuous communication. We publish sustainability updates more frequently than once a year (quarterly dashboards, interim progress reports, or stakeholder briefings). Long-term horizon. Our sustainability strategy is anchored to a 10+ year horizon, with published interim milestones and progress tracking.
Your score: ___ /11
9–11: You are operating at the leading edge. Focus on continuous improvement and assurance. 5–8: Solid foundations, with identified gaps. Prioritise the lowest-scoring category first. 0–4: You have infrastructure work to do before your next reporting cycle. Start with the architecture pitfalls, which block everything downstream.
The Diagnosis Is the Starting Point
All ten pitfalls share a common root. Organisations are treating CSR reporting as a communication challenge when the evidence overwhelmingly shows it is a data infrastructure challenge. Better reports are the output. Better systems are the input.
The path forward is specific and operational:
- Use the scorecard above to identify the one pitfall most relevant to your current reporting cycle
- Ask the diagnostic question: Do we have the data architecture to fix it? If the answer is no, that is where the work starts, not with the report, with the pipeline Match the fix to the failure mode:
Integrity failures are data collection problems before they are disclosure problems Architecture failures are governance problems before they are process problems Strategy failures are leadership alignment problems before they are credibility problems Transparency is not a risk to manage. It is a trust asset to build, and like any asset, it compounds when you invest in it consistently and early.
Ready to fix the pipeline behind your CSR report?
Relific helps enterprises move from narrative-led to evidence-led reporting with the data architecture to comply with CSRD, ESRS, and the 2026 EU Green Claims Directive.
Frequently Asked Questions
What is a CSR reporting failure?
A CSR reporting failure is any gap between what a sustainability report claims and what the underlying data or systems can actually support. The most common failures are data integrity gaps, broken collection pipelines, and misalignment with frameworks like GRI, ESRS, or ISSB.
Why do CSR reports lack credibility with investors?
Fewer than 50% of institutional investors rate CSR reports as "highly credible" (KPMG, 2023). The core reasons are unverifiable narrative claims, missing Scope 3 data, absence of third-party assurance, and bespoke formats that cannot be benchmarked against sector peers.
What is the EU Green Claims Directive, and when does it take effect?
The EU Green Claims Directive requires organisations to independently substantiate environmental claims before making them public. Enforcement takes effect from 2026. It converts greenwashing from a reputational risk into a legal liability.
What is double materiality under CSRD?
Double materiality is the CSRD/ESRS requirement to report both how sustainability issues affect the business (financial materiality) and how the business affects society and environment (impact materiality). Both perspectives must be documented with genuine stakeholder input.
Can we skip Scope 3 emissions reporting?
No. Systematically excluding Scope 3 is one of the most damaging CSR reporting pitfalls. Scope 3 typically represents the majority of a company's environmental impact, and CSRD, ISSB, and SEC rules increasingly treat its disclosure as mandatory, not optional.
What's the difference between GRI and ESRS?
GRI is a voluntary global standard focused on impact materiality, how the organisation affects the world. ESRS is mandatory under CSRD for EU-scope entities and requires double materiality, both financial and impact perspectives. Many organisations use GRI as a foundation and extend to ESRS for compliance.
How often should we publish sustainability updates?
Annual reports remain the primary disclosure, but leading organisations publish quarterly dashboards, mid-year updates, and stakeholder-specific briefings. Continuous communication builds trust more effectively than a single annual broadcast.
What is a "broken data pipeline" in ESG reporting?
A broken ESG data pipeline is a reporting infrastructure where sustainability data is collected manually via spreadsheets, without standardised definitions, version control, or automated validation. It introduces human error, inconsistency across departments, and makes audit-grade reporting impossible.
Are aspirational targets like "Net Zero by 2040" still enough?
No. Targets without stated baselines, measurement methodology, and intermediate milestones are treated as intent, not commitment, by rating agencies and regulators. SBTi validation is now a baseline expectation for credibility.
What should a CSR report include to be audit-grade?
An audit-grade CSR report includes: sourced and methodology-backed metrics; alignment to a recognised framework (GRI, ESRS, ISSB, or SASB); documented stakeholder engagement; multi-year trend data; third-party assurance on material metrics; and transparent reporting against targets, including missed ones.